Introduction
People who are handling their money wisely have been dealing with the stock market for a long time. For them, investing the money at the stock market would give them a better chance of earning profit compared to other investment options. Learning how to invest in the stock market is easy, and one would be an expert in it over time. For first-timers, learning how the stock market works is the first thing that they need to do. They need to start with the basics, like knowing what a stock market chart it. From there, they could learn other things that would transform them from being a newbie to a stock market expert.
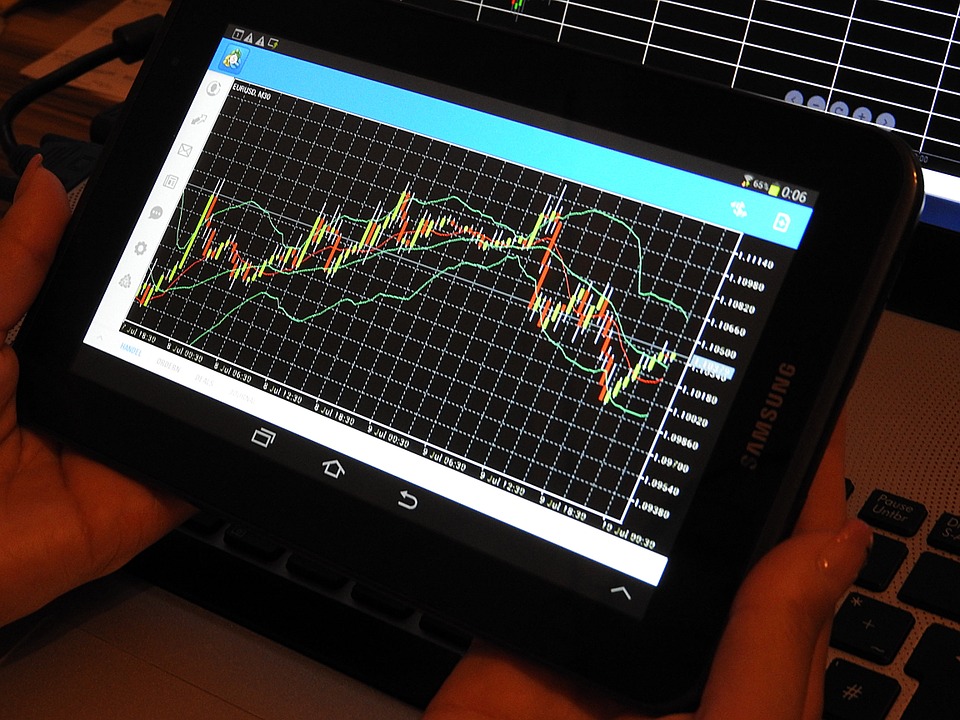
A stock market chart is an important graph that is being studied by experts and investors alike. Knowing how it will move is essential for someone who wanted to become successful in the field of trading. The chart has multiple elements, and familiarizing on these elements would make someone confident in handling transactions and trades within the stock market. These elements are the price and volume of a security, the moving average lines, and the relative strength line. It can be a daunting task at first, but familiarizing with these elements would enable someone to develop an advantage versus other traders, making the stock market a profitable place to be.
Price and Volume of a Security
These are the first two elements that one should familiarize with, and knowing how they would allow someone to predict how the changes would apply, making them ready for any deals or transactions. The price of the security/share is displayed on the chart, and it will provide the investor with an idea of how expensive it is at the moment. The price changes throughout the day, and external factors could affect its performance. Charts display the price of a security/share, and it all depends on the trader if they wanted to buy or sell, depending on the information provided by the chart. Another thing to watch out for would be the volume of the security/share. It tells how much of the share is being bought or sold by investors. There are things that you also need to pay attention to, like the number of shares that are being traded, and the number of volumes speaks about it. If many people are trying to sell their shares, the volume will go down, and it should be a warning sign that you have to sell your shares too. However, if the volume goes up, you have to wait for a little longer because the value might also increase.
Moving Average Lines
These lines show how the price of a stock changes through time. This element is important because it tells a story about a stock, and it could influence your actions if you will buy it or not. Successful stocks have an upward trend on their moving average lines, signifying that their value went up over time. Many successful traders are using their skills on checking the moving average line for them to purchase stocks which are strong in the market and have a high chance of its value to increase.
Relative Strength Line
This is also a good way to determine if the stock that you purchased is strong in the market and would become profitable someday. The line will be compared to the top companies in the market, and if a stock went high above the top companies, it means that investing in it is a good idea because their value would go up. However, if a stock’s performance falls below that of the top companies, it means that one should be cautious in investing their money to the company.